
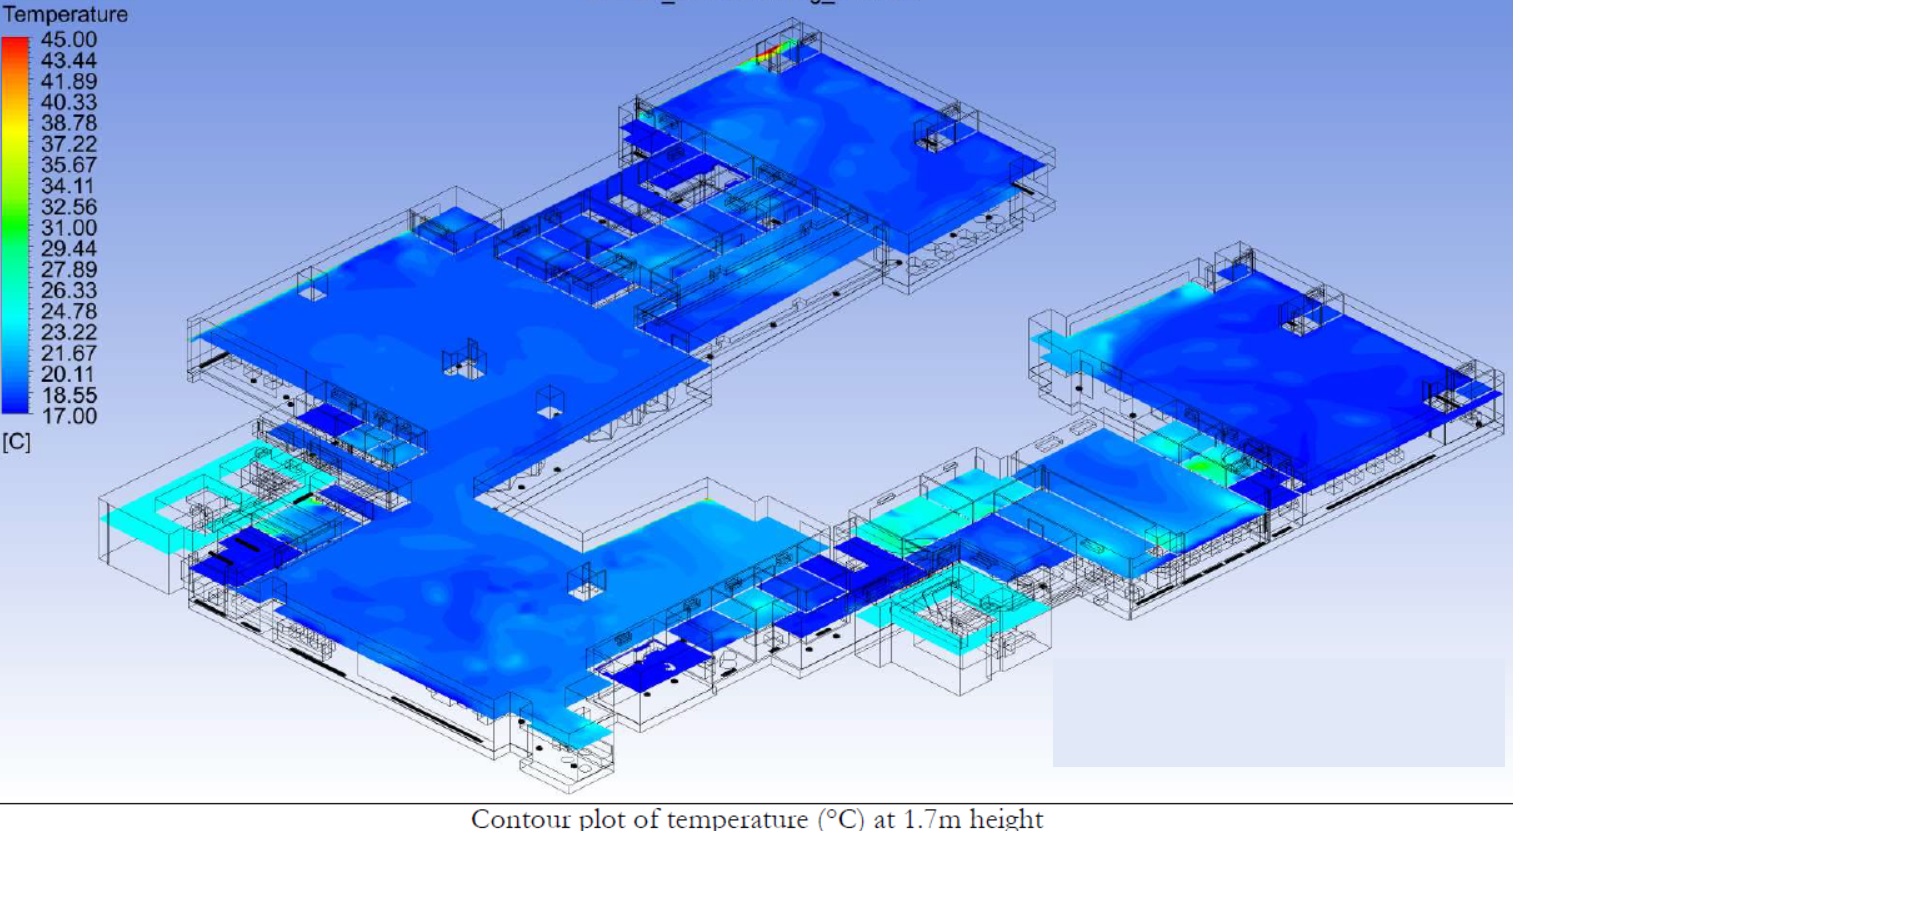
Thermal Comfort Analysis — temperature contour plot at 1.7 m occupancy height.
Thermal Comfort Analysis Explained: PMV, PPD, ASHRAE 55 & How ANSYS Fluent CFD Makes It Possible
What is Thermal Comfort Analysis? A full technical breakdown of PMV, PPD, ASHRAE 55, ISO 7730 and CFD methodology — plus a look at how SuperDesignTech runs these studies on licensed ANSYS Fluent for clients across the USA, Canada and Europe.
What Is Thermal Comfort Analysis?
Thermal Comfort Analysis is an engineering simulation practice that predicts how occupants of a space will physically experience its thermal environment — not just the air temperature on a thermostat, but the combined effect of air temperature, air velocity, humidity, radiant heat, clothing, and activity level on the human body. Instead of relying on a single sensor reading, thermal comfort analysis uses Computational Fluid Dynamics (CFD) to simulate the full three-dimensional airflow and heat-transfer field inside a room, building, or facility, then converts that field into standardized human-comfort indices.
In practice, this means building a digital twin of a space — an office floor, a hospital ward, an airport terminal, a cleanroom, or a data hall — and numerically solving the governing equations of fluid motion and heat transfer across a discretized mesh of that geometry. The output isn't just "the room is 22°C"; it's a spatial map showing exactly where draughts occur, where radiant heat from a glazed façade raises perceived temperature, and where HVAC diffuser placement leaves occupants under- or over-cooled.
Why Thermal Comfort Analysis Matters
Thermal comfort is not a cosmetic concern — it directly affects occupant health, productivity, and regulatory compliance. Poorly distributed airflow can leave one side of an office too cold while the other overheats, even though the average room temperature looks fine on paper. In healthcare facilities, thermal stratification can affect infection control and patient recovery. In airports and transit hubs, thermal discomfort at scale becomes a measurable passenger-experience problem.
- Occupant health & productivity — thermal discomfort measurably reduces cognitive performance and increases sick-building complaints.
- Green building certification — LEED, BREEAM, and the WELL Building Standard all require documented thermal comfort performance.
- Energy efficiency — over-cooling or over-heating to "play it safe" wastes energy; CFD lets engineers right-size HVAC output instead of over-designing.
- Design validation before construction — problems found in a CFD model cost nothing to fix; problems found after occupancy require retrofits.
- Regulatory and code compliance — many jurisdictions now expect ASHRAE 55, ISO 7730 or EN 15251 evidence as part of building sign-off.
Key Technical Terminology
Thermal Comfort Analysis draws on both fluid dynamics and human physiology. Here are the terms that appear in almost every technical report:
Computational Fluid Dynamics (CFD)
CFD is the numerical solution of the Navier-Stokes equations — the governing equations of fluid motion — combined with energy and species-transport equations, solved across millions of small control volumes (a mesh) that discretize the 3D geometry of a room or building.
Mesh / Meshing
Before a solver can run, the 3D geometry (imported from CAD or BIM) must be broken into a fine grid of cells — tetrahedral, hexahedral, or polyhedral — called a mesh. Mesh quality and refinement near walls, diffusers, and occupants strongly influence solution accuracy.
Turbulence Modeling (k-ε, k-ω SST)
Indoor airflow driven by HVAC diffusers is turbulent, not smooth. Solvers approximate turbulence using models such as k-epsilon (k-ε) or k-omega SST, which balance computational cost against the accuracy needed to capture recirculation zones and jet mixing.
Radiation Modeling (Discrete Ordinates / DO)
Solar gain through glazing and radiant heat exchange between surfaces significantly affects perceived comfort. The Discrete Ordinates (DO) radiation model is commonly activated to capture how solar energy passing through windows heats interior surfaces and, in turn, the surrounding air.
Mean Radiant Temperature (MRT)
MRT is the uniform surface temperature of an imaginary enclosure that would exchange the same amount of radiant heat with a person as the actual, non-uniform surrounding surfaces. It's a critical input to comfort calculations and is often the variable most affected by glazing, radiant panels, or nearby equipment.
Operative Temperature
A single combined value that accounts for both air temperature and mean radiant temperature, used as a practical proxy for how "warm" a space feels to an occupant.
Metabolic Rate (met) & Clothing Insulation (clo)
Human comfort depends on more than the room — it depends on the person. Metabolic rate (measured in met units, where 1 met ≈ a seated, resting person) and clothing insulation (measured in clo units) are required inputs to any standards-based comfort calculation.
User-Defined Functions (UDFs)
ANSYS Fluent allows engineers to write custom UDFs in C to extend the solver — for example, calculating PMV and PPD from the simulated flow field using the Fanger model equations, since these physiological comfort indices aren't native solver outputs.
The PMV / PPD Scale — The Core Metrics of Thermal Comfort
The two indices that define modern thermal comfort engineering were developed by Danish researcher P.O. Fanger and are collectively known as the Fanger model:
-
PMV — Predicted Mean Vote: a value on a seven-point thermal sensation scale, from
-3(cold) through0(neutral) to+3(hot), predicting the average thermal sensation vote of a large group of people exposed to the same environment. - PPD — Predicted Percentage of Dissatisfied: derived mathematically from PMV, this predicts the percentage of occupants who would report thermal dissatisfaction — either too warm or too cold — even at a "neutral" PMV of zero, because full unanimous comfort is physiologically impossible.
| PMV Value | Sensation | Typical PPD |
|---|---|---|
| -3 | Cold | ~99% |
| -2 | Cool | ~76% |
| -1 | Slightly Cool | ~26% |
| 0 | Neutral | ~5% (minimum achievable) |
| +1 | Slightly Warm | ~26% |
| +2 | Warm | ~76% |
| +3 | Hot | ~99% |
PMV and PPD are calculated from six inputs: air temperature, mean radiant temperature, air velocity, relative humidity, metabolic rate, and clothing insulation — the first four of which come directly out of the CFD flow-field solution, cell by cell across the occupied zone.
Governing Standards: ASHRAE 55, ISO 7730 & EN 15251
Thermal comfort analysis isn't just descriptive engineering — it's typically performed against a recognized standard so that results are defensible to regulators, certifiers, and building owners.
- ASHRAE 55 (Thermal Environmental Conditions for Human Occupancy) — the primary North American standard, defining acceptable PMV/PPD ranges and comfort zone charts, widely referenced in LEED and building-code submissions across the USA and Canada.
- ISO 7730 — the international standard formalizing the Fanger PMV/PPD model and defining three comfort categories (A, B, C) with progressively wider acceptable dissatisfaction ranges.
- EN 15251 — the European standard for indoor environmental input parameters, commonly referenced alongside EU Green Deal sustainability requirements for buildings in the UK, Germany, France, and the Netherlands.
How a CFD Thermal Comfort Study Is Actually Run
The end-to-end simulation workflow typically follows five stages:
- Geometry import: A 3D model of the space is built or imported from CAD/BIM data, including furniture, occupants, glazing, and HVAC diffusers/returns.
- Meshing: The geometry is discretized into a computational mesh, refined near walls, occupants, and airflow inlets where gradients are steepest.
- Boundary conditions & physics setup: Inlet velocities and temperatures, wall properties, solar loads, turbulence model, and radiation model are defined.
- Solving: The solver iterates the coupled momentum, energy, and turbulence equations to convergence, producing a full 3D field of temperature, velocity, and humidity.
- Post-processing: PMV/PPD is computed at occupant height (commonly 1.1 m seated or 1.7 m standing) and visualized as contour plots, vector fields, and compliance tables against ASHRAE 55 / ISO 7730 thresholds.
How SuperDesignTech Performs Thermal Comfort Analysis Using Licensed ANSYS Fluent
SuperDesignTech is a specialist CFD Analysis consultancy that has built its entire practice around exactly the methodology described above — with over 20 years of focused Computational Fluid Dynamics experience delivered under the leadership of Principal CFD Engineer Rohit Sharma. Rather than treating thermal comfort as one service among many, SuperDesignTech runs every Thermal Comfort Analysis project as a dedicated CFD simulation, using commercially licensed ANSYS Fluent rather than student or freeware editions — a distinction that matters because licensed, vendor-supported solvers are what regulatory bodies and certification assessors expect to see behind an engineering report.
Licensed Software Stack
For Thermal Comfort Analysis specifically, SuperDesignTech uses ANSYS Fluent for high-accuracy turbulence modeling, heat transfer, and PMV/PPD multi-physics coupling. For very large or computationally heavy models, simulations can be scaled onto Rescale Cloud HPC, a licensed high-performance computing platform that shortens turnaround on full-building models. For their separate Data Center CFD Analysis service line, the practice also holds licensed expertise in DCX by Cadence (formerly Future Facilities) — Rohit Sharma completed exclusive, in-person DCX training delivered by senior engineers at Future Facilities Ltd. in London in Summer 2020.
Standards-Compliant Deliverables
Every Thermal Comfort Analysis project is benchmarked against ASHRAE 55 and ISO 7730, with EN 15251 applied for European clients. This makes SuperDesignTech's reports directly usable as supporting evidence for LEED, BREEAM, and WELL Building Standard certification submissions, and compatible with Canada's National Energy Code for Buildings (NECB) where applicable.
Their Project Workflow
Discovery Brief
Understanding the facility, design intent, and specific thermal or airflow challenge.
Geometry & Model
Building or importing accurate 3D geometry from CAD/BIM with precise boundary conditions.
CFD Simulation
High-fidelity simulation in licensed ANSYS Fluent, scaled on Rescale HPC when needed.
Analysis & Insight
PMV/PPD contour maps, airflow vectors, and hot/cold-spot identification at occupant height.
Report & Deliver
A full engineering report with visualizations, compliance findings, and design recommendations.
Who It's For
SuperDesignTech applies this ANSYS Fluent-based Thermal Comfort Analysis workflow to offices, hospitals, cleanrooms, airports, and commercial buildings for clients across the USA, Canada, and Europe (including the UK, Germany, France, the Netherlands, Ireland, and Sweden) — delivered 100% remotely, with typical turnaround of 5–10 business days for a single-zone study.
Need an ASHRAE 55 / ISO 7730 compliant Thermal Comfort Analysis for your building, backed by licensed ANSYS Fluent simulation?
Request a Free Consultation →Frequently Asked Questions
What is the difference between PMV and PPD?
PMV predicts the average thermal sensation of a group on a -3 to +3 scale, while PPD converts that PMV value into the predicted percentage of people who would be dissatisfied with the thermal environment — even at a perfectly neutral PMV of zero, around 5% of occupants are still predicted to be dissatisfied.
Why is ANSYS Fluent used for Thermal Comfort Analysis instead of simpler tools?
Basic energy-modeling software can estimate average room temperature, but it cannot resolve spatial variation in airflow, draughts, or radiant asymmetry. ANSYS Fluent solves the full 3D flow and heat transfer field, which is what a genuine PMV/PPD calculation at occupant height actually requires.
How long does a Thermal Comfort Analysis project typically take?
A single-zone study generally takes 5–10 business days from geometry receipt to final report, while larger multi-zone buildings or facility-wide studies take longer depending on mesh size and simulation complexity.
Does Thermal Comfort Analysis support green building certification?
Yes. PMV/PPD studies benchmarked against ASHRAE 55 or ISO 7730 are commonly submitted as supporting documentation for LEED, BREEAM, and WELL Building Standard certifications.
0 Comments
Be the first to share your thoughts on this article.
Leave a Comment